


A Detailed Report and A Comparative Analysis of Specialist Physician Wait Times: Major Metropolitan Areas in Canada and the United States
This report provides an exhaustive comparative analysis of specialist physician wait times in major metropolitan centers across Canada and the United States. It examines the quantitative data on wait times, analyzes the systemic structures that produce these outcomes, and evaluates the profound impact of these delays on patients and healthcare systems. The core finding of this analysis is that Canada and the United States employ fundamentally different philosophies for rationing access to specialist care. Canada’s single-payer, universal system primarily rations care through a time-based queue, resulting in longer, more transparently measured, and more equitably experienced wait times. Conversely, the U.S.’s multi-payer, market-based system rations care through a complex web of financial, insurance-related, and administrative barriers, resulting in shorter average appointment waits for well-insured patients but profound inequities in access for others.
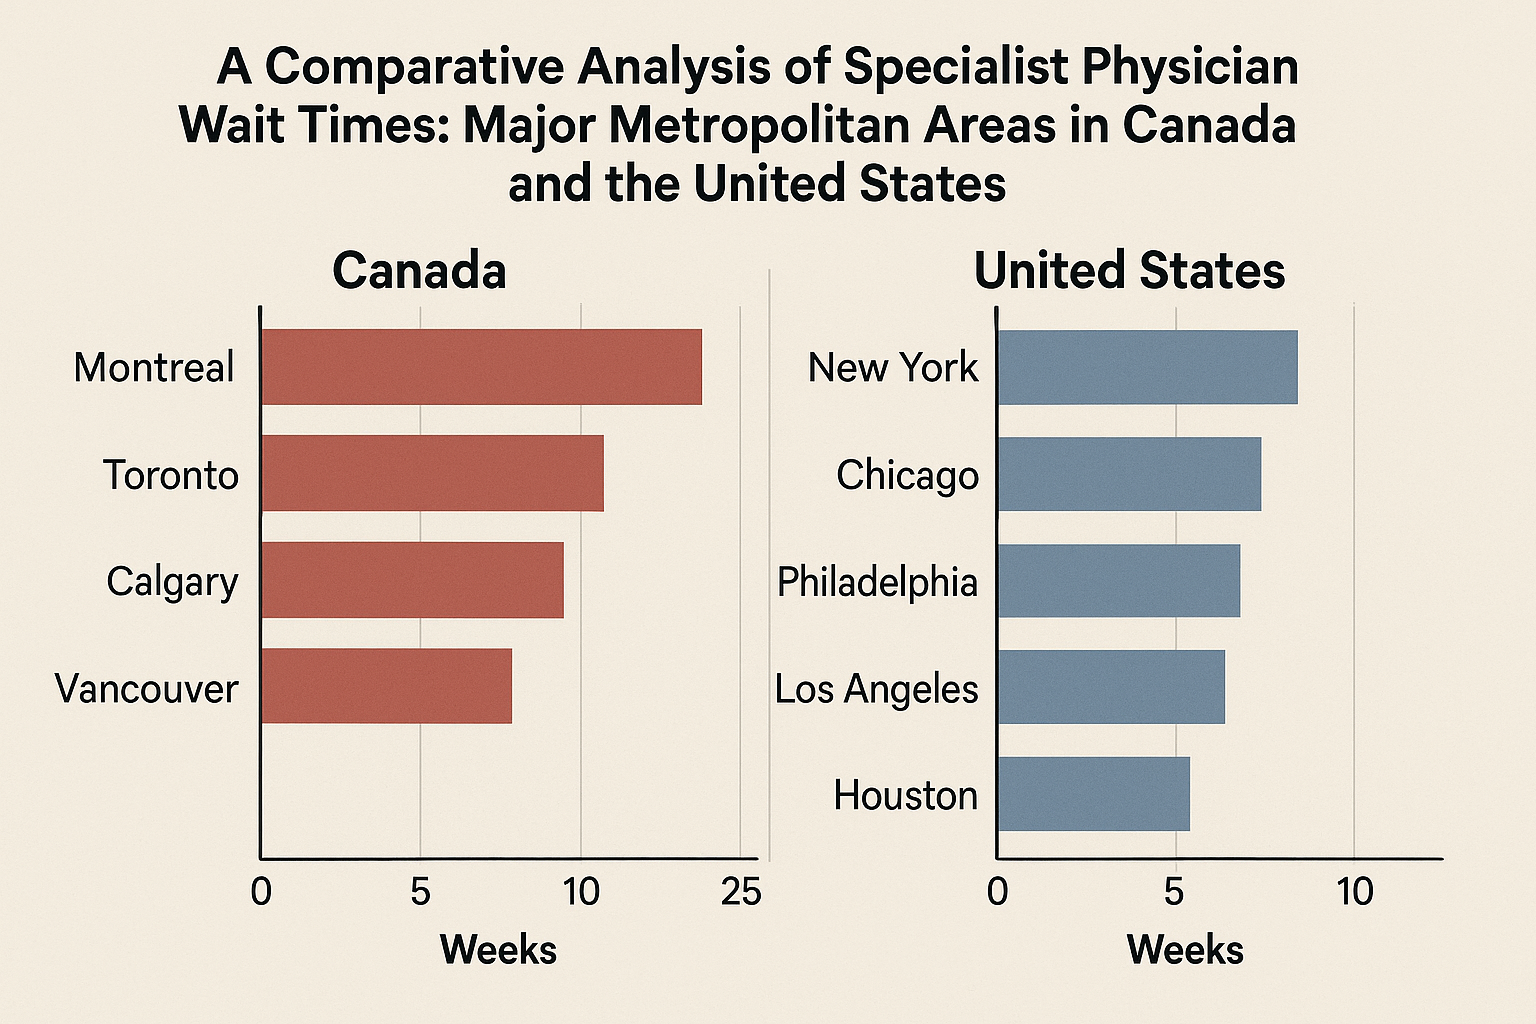
In Canada, the 2024 national median wait time from referral by a general practitioner (GP) to the receipt of treatment has reached a historic high of 30.0 weeks. This total wait is composed of two distinct and lengthy segments: a 15.0-week median wait for an initial consultation with a specialist, followed by an additional 15.0-week median wait for treatment. This reality is not uniform across the country; staggering provincial disparities exist, with total wait times ranging from a low of 23.6 weeks in Ontario to a crisis level of 77.4 weeks in Prince Edward Island. The consequences for patients are severe, with a 2024 Statistics Canada survey revealing that nearly two-thirds (64%) of patients reported that the wait for care negatively impacted their lives, causing significant stress, anxiety, and pain.
In the United States, the average wait time to schedule a new physician appointment across 15 major cities surged to 31 days in 2025, a significant increase from 26 days in 2022. This national average masks extreme variations by both specialty and metropolitan area. Wait times for an orthopedic surgeon average just 12 days, while patients seeking a rheumatologist face an average wait of over 68 days. Geographically, the disparity is equally stark, with average waits ranging from 12 days in Atlanta to as high as 70 days in Boston, a city with one of the highest physician-to-population ratios in the country. Critically, these wait times only reflect the delay for patients who have already navigated the primary barriers of insurance coverage, network restrictions, and provider acceptance, particularly for those on public plans like Medicaid.
Ultimately, this report concludes that neither system offers a superior model for timely access. While Canadian wait times are objectively longer, they are a function of a system that prioritizes equity of access over speed. U.S. wait times are shorter on average for those with premium insurance but represent only one hurdle in a system that also rations care by cost, network limitations, and administrative complexity. Both systems are failing to meet the needs of their populations, leading to deleterious health outcomes and an erosion of public trust. The analysis culminates in a series of strategic recommendations tailored to the unique structural challenges of each nation, aimed at improving access, efficiency, and equity in specialist care.
The Canadian Landscape: A System of Universal Access and Systemic Queues
The Canadian healthcare system, rooted in the principle of universal access regardless of ability to pay, presents a paradox: while financial barriers to medically necessary care are largely eliminated, they are replaced by the significant barrier of time. The patient journey from identifying a need for specialized care to receiving treatment is characterized by a series of protracted, systemic queues. Understanding the nature and impact of these wait times requires a multi-faceted examination of national and provincial data, patient-reported experiences, and the structural drivers of delay within a publicly funded model.
Deconstructing the Canadian Wait Time: From Referral to Treatment
The most comprehensive metric for understanding the Canadian patient experience is the “total wait time,” which measures the entire pathway from a GP referral to the ultimate delivery of treatment. This end-to-end measurement reveals a system under significant strain, with delays accumulating at distinct stages of the care continuum.
The 2024 “Waiting Your Turn” report from the Fraser Institute, a survey of specialist physicians across 10 provinces and 12 specialties, provides the most widely cited national data. According to this survey, the national median total wait time reached an unprecedented 30.0 weeks in 2024. This figure represents a notable increase from 27.7 weeks in 2023 and is the longest wait time ever recorded in the survey’s history, standing 222% longer than the 9.3-week wait observed in 1993. This total wait is not a single, monolithic period but is composed of two roughly equal and consecutive segments, each presenting its own challenges to patients and the system.
Segment 1: The Wait for a Specialist Consultation The first critical delay occurs between the GP referral and the initial consultation with a specialist. In 2024, the national median wait for this first step was 15.0 weeks. This “gatekeeper wait” is a direct structural consequence of Canada’s healthcare model, which mandates a referral from a primary care provider to access most specialist services. This period is often characterized by significant uncertainty and anxiety for patients, who have been identified as needing specialized assessment but have no clear timeline for when that assessment will occur. This initial wait has lengthened considerably over time, now standing 305% longer than the 3.7-week wait recorded in 1993, indicating a chronic and worsening bottleneck at the front door of specialized medicine.
Segment 2: The Wait for Treatment Once a patient has consulted with a specialist and a course of treatment has been decided upon, a second waiting period begins. The national median wait from the specialist consultation to the receipt of treatment was also 15.0 weeks in 2024. This segment of the wait reflects the system’s capacity constraints, including the availability of operating rooms, hospital beds, specialized equipment, and health human resources. This 15.0-week wait is significantly longer than what physicians themselves consider to be clinically “reasonable.” Across all specialties, physicians reported that a reasonable wait for treatment would be 8.6 weeks, meaning patients are waiting, on average, 6.3 weeks longer than is medically advisable after their need for treatment has been confirmed.
Embedded Diagnostic Delays Compounding these two primary waiting periods are substantial delays for essential diagnostic technologies, which are often required either before the specialist consultation or between the consultation and treatment. In 2024, Canadians could expect to wait a median of 8.1 weeks for a computed tomography (CT) scan, a staggering 16.2 weeks for a magnetic resonance imaging (MRI) scan, and 5.2 weeks for an ultrasound. These diagnostic delays are not separate from the overall wait but are embedded within it, contributing significantly to the total time a patient spends in the queue and potentially delaying accurate diagnosis and the formulation of a treatment plan.
The Patient Experience: Data from the Front Lines
While physician-reported data provides a measure of system performance, patient-reported surveys offer crucial context on the human cost of these delays. The 2024 Survey on Health Care Access and Experiences from Statistics Canada provides a vital, complementary perspective on how Canadians experience the wait for specialist care.
The survey found that of the 35% of Canadian adults who consulted a specialist in the past year, a significant portion faced long waits for their initial appointment. While 35% waited less than a month, 30% waited one to three months, and 36% waited three months or more. This corroborates the long “gatekeeper wait” identified in physician surveys and highlights that a substantial number of patients are waiting beyond what is generally considered an acceptable timeframe for a first consultation.
Patient satisfaction is directly and inversely correlated with the length of the wait. Among patients who saw a specialist within a month, 83% reported being satisfied or very satisfied with the wait time. This figure drops to 50% for those who waited one to three months and plummets to a mere 17% for those who waited three months or longer. This dramatic decline in satisfaction underscores the profound negative psychological impact of prolonged uncertainty.
Perhaps most critically, the survey quantifies the tangible, negative effects on patients’ lives. Nearly two-thirds of patients (64%) reported that their lives were affected by the wait time. The most common impacts cited were worry, stress, and anxiety (experienced by 66% of those affected), followed by pain (36%), and difficulty with daily activities (32%). Alarmingly, more than one in five patients (22%) reported that their health or medical condition had deteriorated while they were waiting for care. This demonstrates that wait times are not merely an inconvenience but a direct contributor to patient suffering and potentially poorer clinical outcomes.
Provincial Disparities: A Patchwork of Performance
The national median wait time, while a useful benchmark, masks profound disparities in healthcare access across Canada’s provinces. The administration and delivery of healthcare are provincial responsibilities, resulting in what is effectively a federation of ten distinct provincial healthcare systems with vastly different levels of performance.
The 2024 data reveals a stark east-west divide in wait times. Ontario reports the shortest total median wait in the country at 23.6 weeks, followed by Quebec (28.9 weeks) and British Columbia (29.5 weeks). While still substantial, these waits are significantly shorter than those experienced in Atlantic Canada, where patients face a systemic crisis of access.
The longest waits in the nation are found in the Maritime provinces. Prince Edward Island has the longest total wait at an astonishing 77.4 weeks, followed by New Brunswick at 69.4 weeks. Nova Scotia, which had the longest wait in 2023 at 56.7 weeks, and Newfoundland and Labrador at 43.2 weeks, also face wait times far exceeding the national median. These extreme variations are driven by a confluence of factors, including differing levels of provincial health funding, challenges in recruiting and retaining specialist physicians in smaller provinces, and distinct demographic pressures, such as older and more rural populations. This regional variation is a critical feature of the Canadian system, demonstrating that a patient’s access to timely care is heavily dependent on their postal code.
The structure of the Canadian system, with its single-payer funding and GP gatekeeper model, creates a patient journey defined by two distinct and lengthy waiting periods. The first, from GP referral to specialist consultation, is a systemic bottleneck that generates significant patient anxiety. The second, from consultation to treatment, is a clear indicator of insufficient system capacity in terms of personnel, infrastructure, and technology. While the system performs better for the most urgent, life-threatening procedures, the median patient experience for a wide range of elective yet medically necessary care involves waits that are far longer than what physicians consider clinically appropriate. This reality has led to a quantifiable negative impact on the well-being of a majority of patients and has fueled the growth of private virtual care platforms offering to sell a solution to the public system’s overburdened front door. This emerging two-tiered access for initial consultation represents a significant challenge to the principle of equitable access that underpins Canadian Medicare.
The U.S. Landscape: A Market-Driven Mosaic of Access and Barriers
In stark contrast to Canada’s publicly administered queues, the healthcare system in the United States rations specialist care through a complex, market-driven mosaic of financial, administrative, and logistical barriers. While average appointment wait times are generally shorter than the total wait times in Canada, these figures represent only the final hurdle in a system where access is primarily dictated by insurance status, ability to pay, and geography. The American patient’s journey to a specialist is not a single line but a fragmented landscape of varying accessibility, creating profound inequities that are often masked by topline averages.
National Appointment Availability: The “Sticker Shock” of Time
Recent national surveys reveal a clear and worsening trend of longer waits for new patient appointments across the United States, even in metropolitan areas with high concentrations of physicians. This indicates that rising demand, workforce shortages, and systemic inefficiencies are straining the capacity of the U.S. healthcare system.
The most comprehensive recent data comes from the 2025 Survey of Physician Appointment Wait Times by AMN Healthcare, which found the average time to schedule a new physician appointment across six specialties in 15 major U.S. cities has surged to 31 days. This represents a 19% increase from the 26-day average in 2022 and a 48% increase from the 21-day average when the survey was first conducted in 2004.
A separate 2024 study by ECG Management Consultants corroborates this trend, finding an average wait of 38 days for the “third next available appointment” across 11 medical specialties in 23 metro areas. The use of the “third next available” metric is a standard industry practice designed to provide a more stable measure of access by avoiding anomalies from last-minute cancellations.
These national averages conceal dramatic variations between medical specialties, pointing to a severe misalignment between patient demand and physician supply in specific fields. Procedural specialties tend to have shorter waits, while cognitive, non-procedural specialties face the longest delays.
- Shortest Waits: Orthopedic surgery has the shortest average wait time at just 12 days.
- Longest Waits: Patients seeking care from cognitive specialists face daunting delays. Rheumatology has the longest average wait at over 68 days, followed by Neurology at 63 days, Gastroenterology at 48 days, and Dermatology at 40 days.
These figures suggest critical workforce shortages and capacity issues in specialties that manage chronic and complex diseases, a problem exacerbated by an aging population and reimbursement models that often favor procedures over time-intensive patient management.
The Decisive Role of Insurance and Geography
In the U.S. system, the “wait time” for an appointment is a secondary barrier; the primary gatekeeper is a patient’s insurance coverage. Before a patient can even attempt to schedule an appointment, they must first navigate a complex set of financial and network-based restrictions that determine if, where, and from whom they can receive care.
Insurance as the Primary Gatekeeper: The type of health insurance plan a patient holds is the single most important determinant of their path to a specialist.
PPO vs. HMO: Patients with Preferred Provider Organization (PPO) plans, which are typically more expensive, often have the freedom to self-refer and see any specialist within a broad network, and sometimes even out-of-network. In contrast, patients with Health Maintenance Organization (HMO) or Point of Service (POS) plans must first obtain a referral from their designated Primary Care Physician (PCP), a gatekeeper model similar to Canada’s, designed to control costs.
Medicaid and Medicare Acceptance: Access is most severely restricted for patients on public insurance plans. The 2025 AMN survey found that while 82% of physicians in major cities accept Medicare (for seniors), only 53% accept Medicaid (for low-income individuals). This low acceptance rate, driven by lower reimbursement levels, creates “access deserts” where Medicaid patients may be unable to find a specialist to treat them at all, making the concept of a “wait time” moot. Studies have consistently shown that even when they can find a provider, Medicaid patients face significantly longer waits to schedule an appointment compared to their privately insured counterparts.
Metropolitan Market Disparities: Unlike Canada, where disparities are primarily drawn along provincial lines, the U.S. exhibits extreme variations in access even between major, well-resourced metropolitan areas. This demonstrates that local market dynamics—such as health system consolidation, dominant insurance networks, and provider competition—play a more significant role than the simple supply of physicians.
The 2024 and 2025 surveys reveal a startling range in average wait times across all specialties:
- Shortest Waits: Atlanta (12 days), Houston (27 days), and New York City (28 days) have the most favorable access.
- Longest Waits: Boston has the longest average wait time in the country, at a staggering 70 days. Other cities with long waits include Cincinnati (47 days), Minneapolis (45 days), and Seattle (44 days).
The fact that Boston, a city renowned for its high concentration of physicians and world-class academic medical centers, has the longest wait times is a powerful illustration of the system’s complexities. It proves that a high physician-to-population ratio does not, on its own, guarantee timely access. Instead, it suggests that factors like market consolidation, the negotiating power of large hospital systems and insurance plans, and administrative inefficiencies are the dominant drivers of patient access.
The American system rations specialist care not through a single, orderly queue, but through a multi-layered system of financial and logistical hurdles. The average appointment wait time of 31 days is a significant and worsening problem, but it represents only the final delay for patients who have already successfully navigated the primary barriers of affording insurance, finding an in-network specialist, and confirming that the provider accepts their specific plan. This creates a deeply inequitable system where timeliness of care is often a function of wealth and insurance status. Furthermore, the severe workforce shortages in key cognitive specialties like rheumatology and neurology indicate a structural misalignment in the physician pipeline, one that is failing to meet the growing needs of a population with increasingly complex chronic diseases.
City-Level Deep Dive: A Cross-Border Comparison
This section provides a granular, city-by-city comparison of specialist wait times, juxtaposing the experiences in major Canadian and U.S. metropolitan areas. It is critical to preface this analysis with a methodological caveat: the data being compared are fundamentally different. Canadian data, primarily from the Fraser Institute, typically measures the total median wait time in weeks from a GP referral to final treatment at a provincial level. U.S. data, primarily from AMN Healthcare and ECG Management Consultants, measures the average wait time in days for a new patient appointment at a city level.
Despite this “apples-to-oranges” challenge, the comparison is invaluable. It starkly illustrates the different scales of delay and the distinct nature of the patient journey in each country. By converting all data to days, the table below provides a snapshot of these divergent realities, highlighting the trade-offs between Canada’s universal but slow queue and the U.S.’s faster but inequitable market-based access.
Table 1: Comparative Specialist Wait Times in Major Cities (Canada vs. U.S.) (Days)
| Specialist | Toronto, ON | Vancouver, BC | Calgary/Edmonton, AB | Montreal, QC | Ottawa, ON | Winnipeg, MB | Halifax, NS | Fredericton, NB | St. John’s, NL | Charlottetown, PEI | New York, NY | Los Angeles, CA | Chicago, IL |
| Dermatologist | ~270-365¹ | 207 (Provincial)² | 36³ | 202 (Provincial)² | 165 (Provincial)² | 265³⁴ | 274³¹ | 486³⁵ | 302³³ | 542³² | 15⁴ | 35⁴ | 39 (Average)⁵ |
| Endocrinologist | 165 (Provincial)² | 207 (Provincial)² | 235 (Provincial)⁶ | 202 (Provincial)² | 165 (Provincial)² | 265³⁴ | 274³¹ | 486³⁵ | 302³³ | 542³² | ~7-14⁷ | 24⁸ | N/A |
| Dietitian/Nutritionist | N/A | N/A | N/A | N/A | N/A | N/A | N/A | N/A | N/A | N/A | <1⁹ | <1⁹ | N/A |
| Neurologist | 53¹⁰ | 207 (Provincial)² | 81³ | 425¹¹ | 165 (Provincial)² | 265³⁴ | 274³¹ | 486³⁵ | 302³³ | 542³² | 63 (Average)⁵ | 34¹² | 63 (Average)⁵ |
| Rheumatologist | 165 (Provincial)² | 207 (Provincial)² | 235 (Provincial)⁶ | 202 (Provincial)² | 165 (Provincial)² | 265³⁴ | 274³¹ | 486³⁵ | 302³³ | 542³² | >90¹³ | >90¹⁴ | 68 (Average)⁵ |
| Nephrologist | 165 (Provincial)² | 207 (Provincial)² | 84³ | 202 (Provincial)² | 165 (Provincial)² | 265³⁴ | 274³¹ | 486³⁵ | 302³³ | 542³² | 273¹⁵ | >1825¹⁶ | ~14-30¹⁷ |
| Gynecologist | 165 (Provincial)² | 207 (Provincial)² | 69³ | 202 (Provincial)² | 165 (Provincial)² | 265³⁴ | 274³¹ | 364³⁵ | 302³³ | 542³² | 42¹⁸ | 42¹⁸ | 42¹⁸ |
| Gastroenterologist | 165 (Provincial)² | 207 (Provincial)² | 104³ | >730¹⁹ | 165 (Provincial)² | 265³⁴ | 274³¹ | 486³⁵ | 302³³ | 542³² | 40¹⁸ | ~15-35²⁰ | <7²¹ |
| Pulmonologist | 165 (Provincial)² | 207 (Provincial)² | 235 (Provincial)⁶ | 425¹¹ | 165 (Provincial)² | 265³⁴ | 274³¹ | 486³⁵ | 302³³ | 542³² | Short Wait²² | No Wait²³ | N/A |
| Hematologist | 165 (Provincial)² | 207 (Provincial)² | 235 (Provincial)⁶ | 202 (Provincial)² | 165 (Provincial)² | 265³⁴ | 274³¹ | 486³⁵ | 302³³ | 542³² | N/A | N/A | ~1²⁴ |
| Urologist | 165 (Provincial)² | 207 (Provincial)² | 235 (Provincial)⁶ | 202 (Provincial)² | 165 (Provincial)² | 265³⁴ | 274³¹ | 486³⁵ | 302³³ | 542³² | No Long Wait²⁵ | ~15 min²⁶ | <1²⁷ |
| Cardiologist | 165 (Provincial)² | 207 (Provincial)² | 45³ | 202 (Provincial)² | 165 (Provincial)² | 265³⁴ | 274³¹ | 196³⁵ | 302³³ | 542³² | 33¹⁸ | 33¹⁸ | 33¹⁸ |
| Oncologist | 165 (Provincial)² | 207 (Provincial)² | 235 (Provincial)⁶ | 202 (Provincial)² | 165 (Provincial)² | 265³⁴ | 274³¹ | 21³⁵ | 302³³ | 542³² | ~1-3²⁸ | ~1²⁹ | ~1³⁰ |
| City/Province Average | 165 days | 207 days | 235 days | 202 days | 165 days | 265 days | 274 days | 419 days | 302 days | 542 days | 28 days | 24 days | 39 days |
Table Footnotes: ¹ Anecdotal data for public system; private clinics offer faster access. ² Provincial median wait from GP referral to treatment (Fraser Institute, 2024). This is the total wait, not just for an appointment. ³ Median wait in days for an appointment in Edmonton (2011 data). ⁴ Average new patient appointment wait (Merritt Hawkins, 2017). ⁵ Average wait for third-next-available appointment (ECG Consultants, 2024). ⁶ Provincial median wait from GP referral to treatment (Fraser Institute, 2023). ⁷ Private clinic data; public system waits may be longer. ⁸ VA system data for new patients. ⁹ Online booking platforms like Zocdoc report same-day or next-day availability. ¹⁰ Median wait for an appointment in Toronto (2012 data). ¹¹ Quebec Ministry of Health average wait for a consultation (2024 data). ¹² Average wait for Medicare patients. ¹³ Anecdotal report of “several months” wait. ¹⁴ Study showing 32% of patients wait longer than 3 months. ¹⁵ Median wait for a deceased donor kidney transplant, not a consultation. ¹⁶ Wait time for a deceased donor kidney transplant, not a consultation. ¹⁷ Wait time for transplant evaluation. ¹⁸ Average new patient appointment wait (AMN Healthcare, 2025). ¹⁹ Anecdotal patient reports of 2-3 year waits. ²⁰ Online booking platform data showing short in-office waits. ²¹ Major health system reports same-day or within-a-week appointments. ²² Clinic reports “short wait times.” ²³ Patient review reports “no wait time.” ²⁴ Cancer center reports appointments in as little as 24 hours. ²⁵ Hospital reports “without long waiting times.” ²⁶ Patient review reports 15-minute wait in lobby. ²⁷ Immediate care center reports average wait of 30 minutes or less. ²⁸ Cancer center reports appointments “within just a few days.” ²⁹ Specialist sees patients the next day. ³⁰ Cancer center reports appointments within 24 hours. ³¹ Provincial median wait from GP referral to treatment (Fraser Institute, 2024). ³² Provincial median wait from GP referral to treatment (Fraser Institute, 2024).³³ Provincial median wait from GP referral to treatment (Fraser Institute, 2024).³⁴ Provincial median wait from GP referral to treatment (Fraser Institute, 2024).³⁵ Specialty-specific median wait times from. Provincial median wait from GP referral to treatment (Fraser Institute, 2024) used for other specialties.
Analysis of Metropolitan Comparisons
Toronto vs. New York: The contrast between Toronto and New York is stark. As part of Ontario, Toronto benefits from Canada’s shortest provincial total wait time of 165 days (23.6 weeks) from referral to treatment. However, city-level data, though older, suggests the initial wait for an appointment can be lengthy, with a 2012 study finding a median of 53 days. For high-demand specialties like dermatology, waits can extend to 9 months or more in the public system. New York, by contrast, has one of the shortest average appointment waits in the U.S. at just 28 days. For some specialties, access is even faster, with dermatology waits around 15 days and some private endocrinology clinics offering appointments in one to two weeks. This highlights the core difference: a Torontonian enters a single, long, publicly funded queue, while a New Yorker with good insurance can navigate a market to find much faster, albeit more expensive, access.Montreal & Ottawa vs. Chicago: The situation in Quebec is particularly severe. While the provincial total wait time is listed at 202 days (28.9 weeks) , recent data from the province’s own Health Ministry paints a much bleaker picture for the initial consultation. The average wait to see a specialist has ballooned to 425 days, nearly 14 months, a doubling since before the pandemic. Patient reports from Montreal suggest waits of two to three years for a gastroenterologist are not uncommon. Ottawa, within Ontario’s more efficient system, has a provincial average of 165 days, though city-specific guidance suggests waits of five months or more are typical. Chicago’s average appointment wait is 39 days. However, similar to other U.S. cities, this average can be misleading. Patients at high-demand academic medical centers like Northwestern report waits that mirror the Canadian crisis: 1.5 years for gastroenterology and 5 months for an ENT, demonstrating that even in the U.S. market, access to top-tier specialists can involve extreme delays.
Vancouver, Calgary & Edmonton vs. Los Angeles: Western Canada’s major cities also face significant waits. Vancouver is part of British Columbia’s system, with a provincial total wait of 207 days (29.5 weeks). For non-urgent consultations, the wait can be up to 10 months (approximately 300 days). Calgary and Edmonton fall under Alberta’s provincial wait of 235 days (33.5 weeks in 2023). Older data from Edmonton (2011) provides a more granular look at appointment waits, ranging from 36 days for dermatology to 104 days for gastroenterology. Los Angeles presents a dramatically different picture, with an average appointment wait of just 24 days. Furthermore, California has a “Timely Access to Care” law that sets a regulatory target of 15 business days for a non-urgent specialist appointment. While this is a regulatory goal and not always met, it establishes a benchmark for access that is an order of magnitude different from the Canadian reality.
An Outlier Analysis: The Crisis in Atlantic Canada
The wait times in Canada’s Atlantic provinces are so extreme they warrant separate consideration. They represent a systemic failure that far exceeds the national Canadian average and cannot be compared in any meaningful way to the U.S. cities in this analysis. The total median wait from referral to treatment in Prince Edward Island is 542 days (77.4 weeks), in New Brunswick it is 486 days (69.4 weeks), and in Newfoundland and Labrador it is 302 days (43.2 weeks). Data from Halifax, Nova Scotia, shows that for some specific services, such as an immunology clinic, the median wait time can reach 782 days. These figures are not just statistics; they represent years of waiting for necessary medical care. These crisis-level delays are attributable to a combination of severe, long-standing physician shortages, the challenges of providing care to smaller, more rural populations, and unique regional health policy and funding issues that have created a level of inaccessibility unparalleled in the rest of the country.
Systemic Drivers of Wait Times: A Tale of Two Models
The vast differences in specialist wait times between Canada and the United States are not arbitrary; they are the direct and predictable outcomes of the foundational principles, structures, and incentive systems that govern each nation’s approach to healthcare. Canada’s single-payer system is designed to ensure equitable access by removing financial barriers, which necessitates rationing care through time. The U.S.’s multi-payer system is designed around market principles and consumer choice (for those with adequate insurance), which rations care through price, complexity, and network restrictions. Examining these systemic drivers reveals the core trade-offs each country has made between equity, timeliness, and cost.
The Referral Process: Gatekeeping vs. Market Navigation
The journey to see a specialist begins with the referral, and the process in each country could not be more different. This initial step sets the stage for the divergent patient experiences that follow.
Canada’s Single-Point-of-Entry: The Canadian system is built around the primary care physician (PCP) as a mandatory gatekeeper for nearly all specialist services. This “single-point-of-entry” model is intended to ensure appropriate utilization of specialized resources and to coordinate care. The process is highly standardized: a patient sees their GP, who then determines the need for a specialist and sends a referral request. However, the execution is often antiquated. Many referrals are still sent via fax, creating a fragmented, paper-based system prone to delays and lost information. Provincial regulations, such as those from the College of Physicians and Surgeons of Ontario (CPSO), mandate that a specialist’s office must acknowledge receipt of a referral within 14 days. Crucially, this is merely an acknowledgment that the referral was received, not an appointment confirmation. The acknowledgment must indicate whether the referral is accepted and provide an anticipated wait time or an actual appointment date. This process effectively places every referred patient into a single, long queue for a given specialist, with priority based on clinical urgency as determined by the specialist’s office.
The U.S.’s Multi-Channel System: In the United States, there is no single referral process; instead, a patient’s path is dictated by their insurance plan. This creates multiple, parallel channels for accessing specialist care.
- PPO Plans (Direct Access): Patients with Preferred Provider Organization (PPO) plans, which offer greater flexibility at a higher cost, generally do not need a referral to see an in-network specialist. They can self-refer, effectively navigating the healthcare market directly to find a provider and schedule an appointment. This provides the fastest potential path to care.
- HMO/POS Plans (Gatekeeper Model): Patients with Health Maintenance Organization (HMO) or Point of Service (POS) plans operate under a gatekeeper model similar to Canada’s. They must select a PCP and obtain a formal referral before their insurance will cover a visit to a specialist. This is a cost-control mechanism employed by insurers.
This bifurcation creates two distinct classes of access: a fast track for those with flexible, premium insurance and a slower, gate-kept track for those in more restrictive plans.
Resource and Capacity: Physicians, Specialists, and Technology
The availability of healthcare resources—personnel and equipment—is a fundamental determinant of a system’s capacity and, consequently, its wait times. While both countries face challenges, their resource profiles differ in ways that help explain their respective performance.
Table 2: Healthcare System Resource Comparison (Canada vs. U.S.)
| Metric | Canada | United States | Comparable Country Average (OECD) |
| Practicing Physicians per 1,000 pop. | 2.7 | 2.6 | 3.5+ |
| Specialists as % of all Physicians | Lower | ~88% (Highest) | N/A |
| MRI Scanners per million pop. | 10.5 | 40.4 | 17.0 |
| CT Scanners per million pop. | 15.2 | 45.3 | 25.8 |
| Health Spending as % of GDP | 11.3% | 17.6% | 9.6% |
Source: Data synthesized from Peterson-KFF Health System Tracker and Commonwealth Fund reports. Data years may vary slightly by metric.
Physician Supply and Specialist Mix: Both Canada and the U.S. have fewer practicing physicians per capita than the average of comparable high-income countries. The critical difference, however, lies in the composition of their physician workforces. The U.S. has the highest proportion of specialists among comparable countries, with nearly 9 out of 10 doctors being specialists. This heavy skew towards specialization means that while the overall number of doctors is average, the supply of specialists is relatively high. Canada’s system, in contrast, has historically placed a greater emphasis on general practice. This structural difference contributes to the U.S. having a larger pool of specialists available to see patients, which can lead to shorter appointment waits once insurance and referral barriers are cleared.
Diagnostic Technology: The disparity in diagnostic equipment is even more pronounced. The U.S. has approximately four times as many MRI machines and three times as many CT scanners per capita as Canada. This vast difference in technological capacity is a direct contributor to the long diagnostic waits embedded within the Canadian timeline, where a median wait of 16.2 weeks for an MRI is a major system bottleneck. The abundance of diagnostic technology in the U.S., partly driven by the legality of physician self-referral and ownership of imaging centers, means that diagnostic tests are less likely to be a significant source of delay for American patients.
Funding and Incentives: Rationing by Queue vs. Rationing by Price
The funding model of a healthcare system dictates its primary rationing mechanism. Canada’s publicly funded system rations by time, while the U.S.’s multi-payer system rations by price.
Canada (Public Funding): Under Canada’s single-payer system, medically necessary services are free at the point of use. This creates nearly unlimited demand that inevitably outstrips the finite supply of services that can be provided within a fixed provincial budget. Because price cannot be used to moderate demand, the system must ration care through other means—namely, time. Waitlists are therefore not a system flaw but an inherent and unavoidable feature of a publicly funded system that does not use price signals to balance supply and demand. This is a deliberate policy choice that prioritizes financial equity over timeliness.
U.S. (Multi-Payer Funding): The U.S. system rations care through a complex array of price mechanisms. Access is tiered based on an individual’s or employer’s ability to pay for different levels of insurance.
- Premiums, Deductibles, and Co-pays: These direct costs can deter individuals from seeking care or purchasing more comprehensive plans with better specialist access.
- Insurance Type: As discussed, the type of insurance plan directly impacts access and wait times. Studies confirm that patients with public insurance like Medicaid experience significantly longer waits, both to schedule an appointment and in the provider’s office, compared to privately insured patients.The ability to pay for better insurance or to pay out-of-pocket for services allows patients to effectively buy their way to the front of the line, creating a system where timeliness is a commodity
The fundamental trade-off between the two systems is one of equity versus timeliness. The Canadian model is designed to be equitable—every patient, regardless of income, enters the same referral process and waits in the same public queue. The explicit cost of this equity is time. The American model offers the potential for much greater timeliness for those with premium insurance but at the cost of profound inequity, creating significant access barriers for the uninsured, the underinsured, and those reliant on public plans. Furthermore, unique features of the U.S. system, such as physician self-referral for ancillary services like diagnostic imaging, create complex financial incentives that influence utilization and capacity in ways not present in Canada’s public system. These foundational differences in philosophy and structure are the ultimate drivers of the divergent wait time realities experienced by patients in the two countries.
The Patient Experience and Downstream Consequences
Regardless of whether a patient is waiting in a Canadian queue or navigating American insurance hurdles, the consequence of delayed medical care is a universal and multifaceted burden. Prolonged wait times for specialist services have severe downstream effects on patient health, socioeconomic well-being, and the public’s trust in the healthcare system. These impacts transcend national borders and system designs, representing the shared human cost of failing to provide timely care.
Clinical Impact
The most direct and damaging consequence of long wait times is the negative impact on patient health outcomes. Delays in accessing specialist care are not benign periods of waiting; they are often periods of clinical deterioration. Research consistently shows that delays at any stage of the care pathway, from diagnosis to treatment, lead to poorer clinical outcomes, increased mortality rates, and lower patient satisfaction.
For patients with progressive or time-sensitive conditions, these delays can be catastrophic.
- Disease Progression: Chronic conditions can worsen, leading to irreversible damage or increased complexity of treatment. A delay in seeing a rheumatologist can result in permanent joint damage, while a wait for a cardiologist can allow heart disease to advance.
- Delayed Diagnosis: For potentially life-threatening illnesses like cancer, timely diagnosis is critical for a good prognosis. In Canada, 22% of patients reported that their condition worsened while waiting for care. In the UK’s National Health Service (NHS), a system with similar challenges, data shows that thousands of cancer patients wait longer than the recommended 62 days from referral to treatment, with clear evidence that such delays are correlated with poorer survival rates.
- Acute vs. Chronic Conditions: For acute conditions, a timely intervention can be the difference between a full recovery and a permanent disability. For chronic conditions, timely management prevents disease progression and improves quality of life. In both scenarios, waiting compromises the efficacy of care.
Socioeconomic Impact
The burden of waiting for care extends far beyond the clinic, imposing significant economic and psychological costs on patients and their families.
Economic Costs: The inability to work due to pain, disability, or uncertainty while waiting for treatment translates into a substantial economic loss, both for individuals and the broader economy. A Fraser Institute study estimated that wait times for treatment in Canada in 2022 cost patients $3.6 billion in lost wages and productivity, averaging $2,925 per patient. This figure only accounts for the wait between seeing a specialist and receiving treatment; it does not include the economic impact of the initial 12.6-week wait (in 2022) to see the specialist in the first place. When the value of leisure time lost to illness is included, the estimated cost balloons to $10.9 billion. In the U.S., while not quantified in the same way, the economic impact is felt through lost wages from increased absenteeism for medical appointments and reduced productivity while managing an untreated health condition.
Psychological and Social Costs: The period spent waiting for care is often fraught with emotional distress. The 2024 Statistics Canada survey found that among the 64% of Canadian patients whose lives were affected by wait times, two-thirds (66%) experienced worry, stress, and anxiety. This psychological burden is a universal experience. Waiting in pain or with an uncertain diagnosis diminishes a patient’s quality of life and can strain personal relationships, as family members and caregivers also bear the emotional and logistical weight of the delay. This prolonged stress can, in itself, exacerbate physical health conditions.
System Trust and Equity
Long wait times, irrespective of their cause, fundamentally erode public trust and confidence in the healthcare system. This erosion of trust manifests differently in each country but leads to similar outcomes: patient frustration, disengagement, and a search for alternatives.
In Canada, the persistent and worsening wait times are the single greatest threat to public support for the Medicare system. They fuel a continuous and often contentious debate about the role of private healthcare, with a growing number of Canadians turning to private virtual care platforms to bypass public system queues. This trend threatens the core principle of equity that underpins the Canadian system.
In the United States, long waits and access barriers fuel public frustration with the complexity and perceived unfairness of the insurance-based system. The knowledge that access and timeliness are often dependent on one’s insurance plan or ability to pay reinforces perceptions of a two-tiered system and deep-seated inequities in care. In both nations, when patients lose faith in the system’s ability to provide care when they need it, they may delay seeking care in the future, leading to even worse health outcomes and higher downstream costs.
Conclusion and Strategic Recommendations
This comparative analysis reveals that both Canada and the United States are failing to provide consistently timely access to specialist medical care, though their failures stem from different systemic and philosophical foundations. There is no clear “winner” in this comparison; rather, each country’s healthcare system presents a distinct set of trade-offs that result in significant burdens for patients. Canada offers financial security at the cost of a substantial “time tax,” while the U.S. offers the potential for faster care for some at the cost of significant financial barriers and profound inequities for others. Both systems are under immense strain from rising demand, workforce challenges, and systemic inefficiencies, leading to outcomes that are detrimental to patient health and public trust.
Synthesis of Findings
The Canadian model, predicated on universal access, rations care through a single, lengthy, and increasingly strained public queue. The national median wait of 30.0 weeks from referral to treatment is a stark indicator of a system with a severe capacity deficit relative to demand. The patient journey is defined by two long periods of uncertainty—waiting for a consultation and then waiting for treatment—which inflict a quantifiable toll in the form of stress, pain, and worsened health conditions. While equitable in that all citizens face the same public queue, the system’s performance varies dramatically by province, with Atlantic Canada experiencing a crisis of access.
The American model rations care through price, insurance networks, and administrative complexity. The average new appointment wait of 31 days, while shorter than Canada’s total wait, is an incomplete metric that applies only to those who have already surmounted significant financial and logistical hurdles. Access is highly stratified by insurance type, creating a fast track for those with premium PPO plans and significant barriers for the 47% of physicians who do not accept Medicaid in major urban centers. The system’s market-driven nature results in extreme geographic disparities and a workforce misalignment that produces critical shortages in cognitive specialties, even in cities with a high overall number of physicians.
Recommendations for Canada
To address its challenges of systemic queues and capacity constraints, Canada should focus on modernizing its processes and strategically investing in resources.
- Modernize the Referral System: The federal and provincial governments must collaborate to fund and implement national standards for integrated e-referral and e-consultation platforms. Replacing the antiquated and inefficient fax-based system with a digital infrastructure would streamline communication between primary care and specialists, reduce administrative burden, and shorten the critical GP-to-specialist wait time.
- Implement Centralized Triage and Pooled Referrals: Provinces should move away from physician-specific waitlists and toward regional or provincial centralized intake and triage systems for high-volume specialties. A single-point-of-entry system would assess referrals based on urgency and direct patients to the first available appropriate specialist in the region, optimizing the use of available capacity and ensuring patients are not penalized by being referred to a single physician with an exceptionally long queue.
Increase System Capacity with Targeted Funding: Provincial governments must make targeted investments in key bottleneck areas, including diagnostic imaging (particularly MRI), surgical suites, and health human resources. Funding should be specifically directed to the provinces with the longest wait times, such as those in Atlantic Canada, to address the most acute access crises.
Recommendations for the United States
To address its challenges of inequitable access and workforce misalignment, the United States should focus on policies that reduce financial barriers for vulnerable populations and rationalize the physician supply.
- Address Workforce Misalignment and Shortages: Federal and state governments should use financial incentives, such as targeted loan forgiveness programs and adjustments to Graduate Medical Education (GME) funding, to encourage more medical residents to enter high-demand cognitive specialties like rheumatology, neurology, and endocrinology, where the longest appointment wait times exist.
- Improve Access for Publicly Insured Patients: To mitigate the profound access disparities faced by low-income Americans, federal and state governments must increase Medicaid reimbursement rates to be competitive with Medicare and private insurance. This would incentivize more specialists to accept Medicaid patients, expanding provider networks and reducing a critical barrier to care.
- Mandate Wait Time and Price Transparency: The federal government should mandate that all health systems and insurers publicly report clear, standardized, and easily accessible data on both the average price and the average new appointment wait time for common specialist services. This transparency would empower patients and employers to make more informed choices and would introduce a new dimension of accountability and competition based on timely access.
